
Experimental Design’s Ever-Present Gremlin: Statistical Noise - Part 3/4
Aug 30
/
Manisha Arora & Julian Hsu
Note that this blog post is part of a series of how business intuition combines with statistical rigor to create good experimental design. The series started with this blog post.
In a previous blog post, we discussed the risks behind our decision to do an experiment, we can tackle the problem of statistical noise. Your data is noisy and you’ll never be able to perfectly isolate the signals within it. Your users are purchasing and clicking in ways that can never be explained, random traffic patterns mean that your delivery ETAs are never exactly right every time.
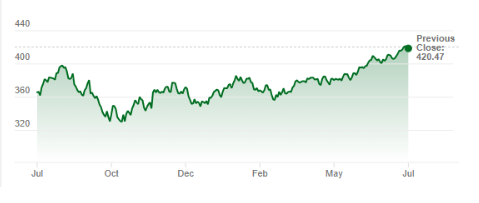
Contexts also change over time - you can look at the stock market prices. Below is the daily price of the Vanguard 500 Index Fund from July-2022 to July -2023. We could predict the general trend over the next few weeks. However, daily predictions are very difficult based on the daily natural fluctuations we see. When you are running an experiment, you are trying to distinguish between the natural variation in noise from the impact your experiment is driving.
Measure Statistical Noise
If we want to tackle statistical noise, then we need to start measuring it. We want to understand how much natural fluctuation there is in our data, which we can measure as the variance. Variance measure how much spread there is in the data. It combines how small and large your data can be with how often it gets so small and large. The more variation, the more fluctuation.
We can, of course, explain some of this variation. Were your shoe sales affected by the weather that day? Was social media aflame with interest right before your stock price increased? We can use models to explain some of this variation (more on this soon). Explained variation is not our problem
Unexplained Variation is the Real Gremlin
The more unexplained variation there is, the harder it will be to measure our experiment. If there are random events influencing your metric, then it will be harder to know whether your metric changed from your experiment of these random events. For example, suppose we are testing a new online ads campaign for our products. However, we know that competitors are also experimenting with their own ads campaigns. If we see our product sales increase, is it due to our ads campaigns, or is it because our competitors’ campaigns?
Reducing the noise in your metric increases the change we can confidently say we measured the impact of the experiment. In other words, we can afford to take more risk in our decision - learn more about how to quantify the risk of your decision here.
Shrinking the Gremlin
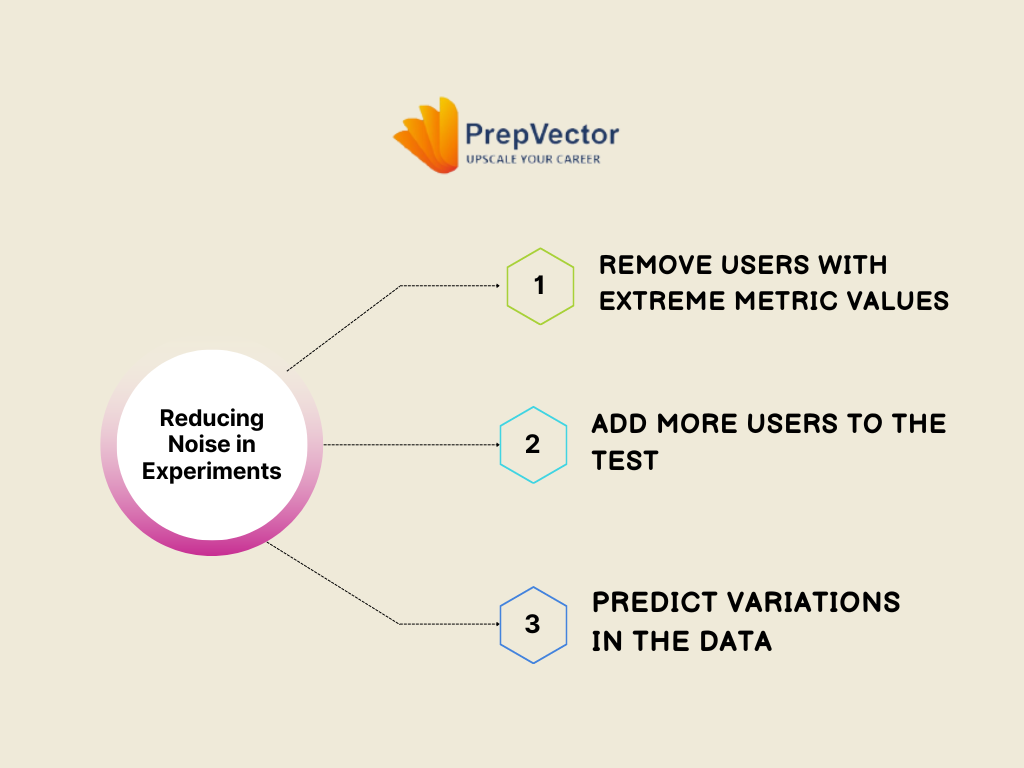
There are three ways to reduce this noise, each with different limitations:
An extra dimension to consider here is how many treatments you have. So far we’ve only talked about placing users in either treatment or control groups. The more treatments we have, the fewer users we can use for each comparison. If there were 1M users we could experiment with and we only had one treatment, we would compare 500K to 500K. Instead if there were four treatments and one control, we would compare 200K to 200K. Adding more treatment arms is the same as reducing the number of users in our experiment, which therefore increases noise.
3. Use prediction models to explain more of the noise. So far, we’ve treated variation in metrics as completely unexplainable. However, if we know about users’ past spending behavior and their characteristics, then we could predict their spend during the experiment. The more variation we can predict, the better we can differentiate between noise and our treatment impact.
Like the previous strategy, there benefits will also plateau. All data are correlated, and adding data that is correlated with others will have minimal additional explanatory power. Unless you start to collect data that is drastically different from what you already have, you will quickly start find there is just some variation you cannot explain.
1. Remove users with unusually low or high metrics.
While it seems counter-intuitive to remove data, removing one or two users with unusually low or high metrics spend will reduce the variance with little detrimental impact on your result. For example, suppose that in your data of user spending, the top spender was $10K each year, and the second highest spend was only $50.
While it seems counter-intuitive to remove data, removing one or two users with unusually low or high metrics spend will reduce the variance with little detrimental impact on your result. For example, suppose that in your data of user spending, the top spender was $10K each year, and the second highest spend was only $50.
Removing this top spender would introduce some bias in your result because you are no longer experimenting with the entire population, but the variance would greatly decrease. A similar strategy would be to replace top spenders’ spend with a number, a process called winsorizing or top-coding. These strategies should be cautiously used, as you are throwing away some of your user data to better measure the impact on other users.
2. Add more users to your experiment. Based on the equation for variance, it will mechanically decrease as we add more users. This is because the more sample size, the more you will be able to distinguish between the natural variation from variation from sampling some users.
2. Add more users to your experiment. Based on the equation for variance, it will mechanically decrease as we add more users. This is because the more sample size, the more you will be able to distinguish between the natural variation from variation from sampling some users.
However, adding more users will increase the experimental cost. This cost could be the cost of recruiting additional users to a platform to see ads, or running the experiment longer so that more new users will see the ads. The benefits of recruiting more users will plateau as well because you’ll eventually have a good idea of what the actual variation is and then there is little benefit of adding more. You should be willing to pay more for the 101th user’s data compared to the 100,001th user’s data.
An extra dimension to consider here is how many treatments you have. So far we’ve only talked about placing users in either treatment or control groups. The more treatments we have, the fewer users we can use for each comparison. If there were 1M users we could experiment with and we only had one treatment, we would compare 500K to 500K. Instead if there were four treatments and one control, we would compare 200K to 200K. Adding more treatment arms is the same as reducing the number of users in our experiment, which therefore increases noise.
3. Use prediction models to explain more of the noise. So far, we’ve treated variation in metrics as completely unexplainable. However, if we know about users’ past spending behavior and their characteristics, then we could predict their spend during the experiment. The more variation we can predict, the better we can differentiate between noise and our treatment impact.
Like the previous strategy, there benefits will also plateau. All data are correlated, and adding data that is correlated with others will have minimal additional explanatory power. Unless you start to collect data that is drastically different from what you already have, you will quickly start find there is just some variation you cannot explain.
Wrapping Up
In this blog post, we talked about how natural variation in our data is an unavoidable challenge. The noisier our data are, the more difficult it is to detect our treatment’s impact with confidence.
Thankfully, we can reduce this noise by (1) being smart about selecting who we experiment with, (2) collecting more users, and (3) collecting more user data. All of these strategies have drawbacks; using all of them will never remove all the noise.
Thankfully, we can reduce this noise by (1) being smart about selecting who we experiment with, (2) collecting more users, and (3) collecting more user data. All of these strategies have drawbacks; using all of them will never remove all the noise.
These strategies will enable you to conduct more nuanced research and experiments, and identify the subtle ways you can innovate in your problem space. Subtle experiments are defined as what your expected impact is, which we will cover in our next blog post.
About the authors
Manish Arora
Lead Data Scientist,
Google
Lead Data Scientist,
Manisha has 10+ years’ experience in Data Science. She is the Experimentation Lead at Google Ads. Manisha is passionate about coaching aspiring Tech Professionals and has coached 300+ data scientists over the past 4 years.
Julian Hsu
Senior Economist,
Amazon
Senior Economist,
Amazon
Julian is an innovative and approachable economist with 14+ years of machine learning, experimentation, and causal ML models. With 6+ years of cross-functional collaboration, he works with product, science, and tech teams to launch productionized solutions.

Copyright © 2022
Contact Us!
Got a question? Reach out to us and we will get back to you ASAP!
Thank you!
One more step!
Just a few details before you can download the resources.
Thank you!
Download your resource here
Download your resource here
One more step!
Just a few details before you can download the resources.
Thank you!
Download your resource here
Download your resource here
By submitting this form, you consent to abide by the Privacy Policy outlined by PrepVector.
One more step!
Just a few details before you can download the resources.
Thank you!
Download your resource here
Download your resource here
One more step!
Just a few details before you can download the resources.
Thank you!
Download your resource here
Download your resource here
One more step!
Just a few details before you can download the resources.
Thank you!
Download your resource here
Download your resource here
One more step!
Just a few details before you can download the resources.
Thank you!
Download your resource here
Download your resource here
One more step!
Just a few details before you can download the resources.
Thank you!
Download your resource here
Download your resource here
One more step!
Just a few details before you can download the resources.
Thank you!
Download your resource here
Download your resource here
One more step!
Just a few details before you can download the resources.
Thank you!
Download your resource here
Download your resource here
One more step!
Just a few details before you can download the resources.
Thank you!
Download your resource here
Download your resource here
Access has ended, sorry.
But you can reach out to us at operations@prepvector.com if you need access to the giveaway.
One more step!
Just a few details before you can download the resources.
Thank you!
Download your resource here
Download your resource here
One more step!
Just a few details before you can download the resources.
Thank you!
Download your resource here
Download your resource here
By submitting this form, you consent to abide by the Privacy Policy outlined by PrepVector.
One more step!
Just a few details before you can download the resources.
Thank you!
Download your resource here
Download your resource here
By submitting this form, you consent to abide by the Privacy Policy outlined by PrepVector.
Created with